Syslog severity levels only become useful when each of the eight values 0 to 7 is tied to an action and a retention rule, not just a colour on a dashboard. Severity is a number, not a verdict. The engineering work is mapping the events a switch actually emits — port down, PoE overcurrent, optical power out of range, a loop, a failed login — to a level, an action and how long the line is kept. Do that first and the log server stays readable; leave it at the defaults and you will be reading debug lines at 03:00 while the disk fills.
Rayin (Shenzhen Rayin Technology) is a manufacturer of GPON OLTs and industrial Ethernet switches.
RFC 5424 §6.2.1 fixes eight severity values, 0 (Emergency) through 7 (Debug), and PRI = Facility × 8 + Severity; that is the only numbering you need.
Most switch events belong at 3 or 4, not 0. Port down, PoE overcurrent and optical power out of range are warnings, not emergencies.
Turning on debug everywhere fills the log disk and steals CPU; keep debug for a fixed window, on one device, with a ticket attached.
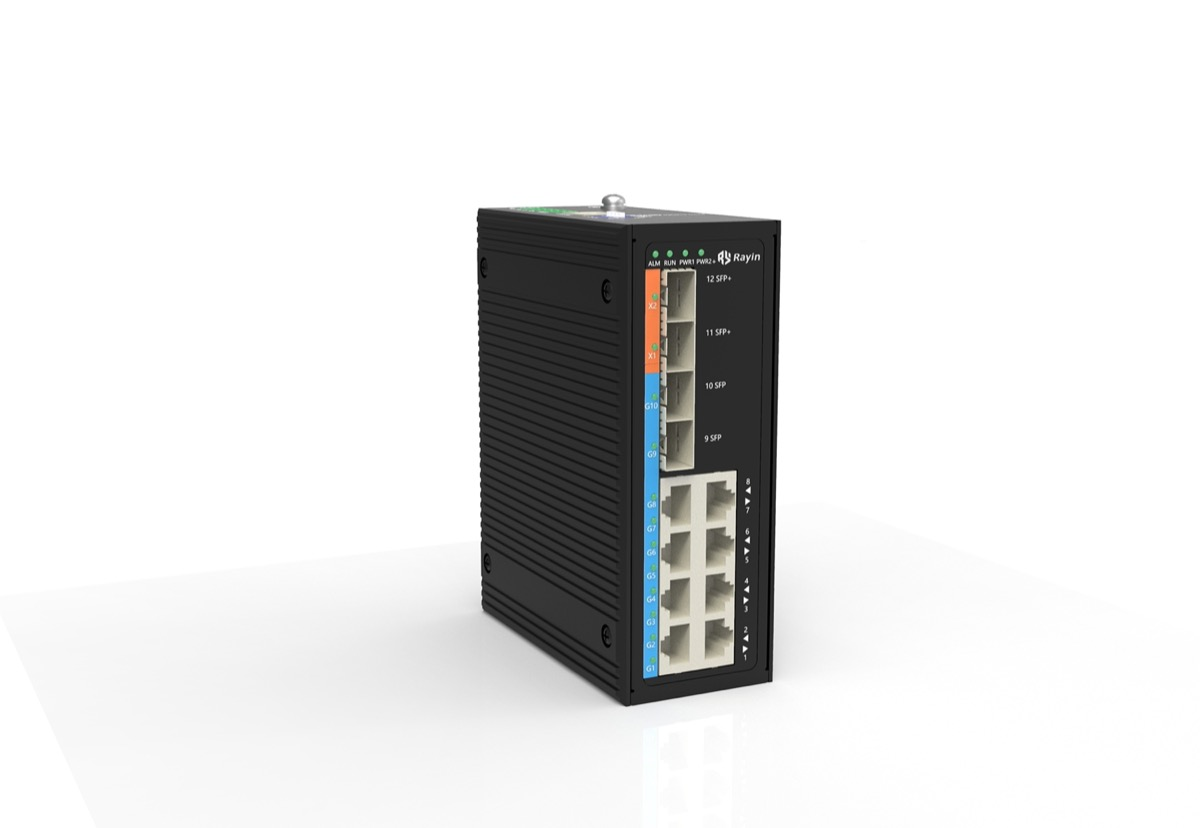
RFC 5424 §6.2.1 defines Severity as an integer 0 to 7, ordered by urgency: 0 is Emergency and 7 is Debug. It also defines the PRI as Facility × 8 + Severity, so a single number in the message header carries both the subsystem that emitted it and how urgent it is. The lower the value, the faster a human should react — which is the opposite of how loud the event feels when a port flaps. Every message a managed switch emits carries one of these eight values. Those are the event classes a Rayin industrial switch reports on a live site.

| Value | Name | Meaning in RFC 5424 §6.2.1 | Example switch event |
|---|---|---|---|
| 0 | Emergency | System is unusable | Stack or chassis loss on the only uplink |
| 1 | Alert | Action must be taken immediately | Redundant power feed lost on both inputs |
| 2 | Critical | Critical conditions | Fan failure with rising internal temperature |
| 3 | Error | Error conditions | Access port down, PoE overcurrent shutdown |
| 4 | Warning | Warning conditions | Optical Rx power near the threshold, CRC climbing |
| 5 | Notice | Normal but significant | Ring topology change, configuration saved |
| 6 | Informational | Informational messages | Successful login, link up at 1 Gbps |
| 7 | Debug | Debug-level messages | Per-packet or per-state-machine tracing |
This is the table that turns a standard into an operations rule. I write it once per site and keep it in a network runbook, because the argument is never about what RFC 5424 says — it is about whether level 3 pages someone at 03:00. Note the ceiling: on a GPON PON port the registration limit is 128 ONU, and a flood of registration events is a capacity symptom, not eight separate emergencies. Loop events belong in the IEEE 802.1D spanning tree context, and a single topology change should not be escalated the same way as a lost uplink.
| Event | Level | Action | Retention |
|---|---|---|---|
| Port down on an access link | 3 | Ticket, no page; suppress flaps | 90 days (industry-typical) |
| PoE overcurrent shutdown | 3 | Ticket, check the powered device | 90 days (industry-typical) |
| Optical Rx power below threshold | 4 | Inspect DDM, schedule a fibre check | 90 days (industry-typical) |
| Loop or topology change | 4 | Correlate with IEEE 802.1D state | 90 days (industry-typical) |
| Failed login, repeated | 4 | Review the access list | 12 months (industry-typical) |
| Successful login, link up | 6 | Store only | 30 days (industry-typical) |
| Debug trace | 7 | Never alert; fixed window only | 7 days (industry-typical) |
Draw the line at level 2. Levels 0 to 2 mean the site is degraded or about to be; everything from 3 down is a condition to record and triage in working hours. The trap is event volume, not severity: a bad fibre contact can flap a port hundreds of times a minute, and if every flap pages, the on-call engineer stops reading the alerts. Suppress repeated identical events, age them out, and let the accumulated count at level 4 drive the ticket. An emergency is a state the site cannot survive, not a message that arrives often. RFC 3164 is the older BSD syslog format and appears here only as historical context; it lacks the structured severity handling RFC 5424 gives you, so do not build new rules on its assumptions.
| Band | Page? | Where it lands | Why |
|---|---|---|---|
| 0 to 2 | Yes, immediately | On-call rotation | The site is degraded now |
| 3 to 4 | No, ticket only | Daily triage queue | Real faults, but survivable |
| 5 to 6 | No | Searchable index | Useful for reconstruction, not action |
| 7 | Never | Short local buffer | Debug is a tool, not a record |
Two things: CPU on the switch and bytes on the log disk. Generating a debug line costs the control plane work, and on a busy device that work competes with the protocols keeping the network up. A switch left at level 7 can emit thousands of lines a minute (industry-typical), which fills a modest log partition in hours and makes every later search slower. Enable debug for a fixed window on one device, measure the CPU and forwarding load with network performance testing tools while the volume climbs, then turn it off and attach the capture to the ticket. If the CPU moves, the level is wrong for that device, not the log server. That is the whole cost model — no datasheet needed.
Retention follows the level, not the device. Keep levels 0 to 2 and security-relevant events for 12 months, routine warnings for 90 days, informational lines for 30 days and debug for 7 days (all industry-typical); roll the summary into an incident postmortem template rather than keeping every raw line searchable. None of that evidence is worth anything without a trustworthy clock, so set NTP on every switch and record the source in the runbook. Syslog, SNMP traps and NTP are usually deployed together — see the industrial O and M overview — but this article stays on severity mapping.
| Band | Industry-typical retention | Storage | Reason |
|---|---|---|---|
| 0 to 2, plus security events | 12 months | Indexed, backed up | Audit and post-incident review |
| 3 to 4 | 90 days | Indexed | Covers a full maintenance cycle |
| 5 to 6 | 30 days | Indexed | Enough to reconstruct a change |
| 7 | 7 days | Local buffer only | Debug volume is not evidence |
Why is debug level 7 instead of level 0?
RFC 5424 §6.2.1 orders the eight values by urgency, not by frequency: 0 is Emergency, the worst case, and 7 is Debug, the noisiest and least urgent. A lower number must wake someone up faster. Reversing the scale would break every rule that filters on severity being less than a threshold.
How is the PRI number calculated?
PRI = Facility × 8 + Severity, as RFC 5424 §6.2.1 states. A Facility of 16 with a Severity of 3 gives 16 × 8 + 3 = 131. That arithmetic is from the RFC, not a product value; the facility identifies the subsystem and the severity carries the urgency your alerting rules act on.
Should every link-down event page an engineer?
No. On a live Rayin switch, a flapping port can log hundreds of link-down events in a minute. Put link-down at level 3 or 4, suppress flaps, and let a network runbook decide what pages someone. In practice three identical messages in ten seconds should produce one ticket.
How long should you keep debug logs?
Days, not months. Keep levels 0 to 2 for 12 months and level 7 for 7 days (industry-typical), then roll the rest into an incident postmortem template rather than a searchable index. Debug volume is what fills the disk, and without a trustworthy NTP timestamp none of it is evidence anyway.
How do I check the CPU cost before enabling debug?
Enable it on one device for a fixed window and measure. Network performance testing tools show whether forwarding or CPU load moves while the log volume climbs; a busy switch can emit thousands of debug lines a minute (industry-typical). If the CPU rises, the level is wrong for that device, not the log server.
The eight levels are the easy part; the mapping and the retention policy are the work. Write the event-to-action table once, put level 2 as the paging line, keep debug in a short window, and set the clock before you trust a single timestamp. Do that and the log server answers questions instead of generating new ones.
The severity and PRI statements above come from public sources — RFC 5424 §6.2.1 (the eight severity values 0 to 7 and the PRI = Facility × 8 + Severity computation), RFC 3164 (the older BSD syslog format, historical context only) and IEEE 802.1D (spanning tree behaviour behind loop events). Only the RFC 5424 clause is numbered; the other two are cited by series name only. The method, worked examples and wording are written by Sara, who checked each figure against those sources before publication. Anything presented as an industry-typical value is labelled as such; nothing here is a measured figure from a Rayin product or a claim of any certification.
About the author: Sara — Sara is a Customer Manager at Rayin with over 10 years of experience in the communications field. In her free time, she enjoys badminton and swimming.
About Rayin: Shenzhen Rayin Technology Co., Ltd. — Company Profile