FTTH network design for a small ISP should move in order from service-area demand to split ratio, splitter hierarchy, optical budget, uplink capacity, and finally subscriber services. That sequence prevents an attractive bill of materials from hiding an overloaded PON port or a marginal optical path.
Rayin (Shenzhen Rayin Technology) is a manufacturer of GPON OLTs and industrial Ethernet switches.
Count passed homes, serviceable homes, and expected subscribers separately; then reserve at least 20% for growth rather than filling every port on launch day.
A higher split ratio is not automatically economical. Going from 1:32 to 1:64 halves OLT port demand but cuts equal-share upstream from about 38.9 to 19.4 Mbps and adds roughly 3.5 dB of loss; going to 1:128 halves it again to about 9.7 Mbps and calls for Class C+ optics rather than the usual Class B+.
Close the design with two independent checks: an optical budget with an industry-typical 3 dB engineering margin and a busy-hour bandwidth model that includes concurrency and protocol overhead.
Start with a map, not an OLT catalog. Divide the target area into distribution zones that can be surveyed, built, and repaired independently. For each zone, record homes passed, homes serviceable, expected take rate, route length, and a realistic three-year ceiling. If 1,000 homes are passed but only 60% can be connected under current landlord and right-of-way conditions, the immediate serviceable base is 600, not 1,000.
Apply take rate only after that filter. A 45% first-year take rate on 600 serviceable homes produces 270 subscribers. Keep physical capacity for the larger serviceable number, but phase active electronics around the expected subscriber ramp. This distinction prevents both stranded equipment and an ODN rebuild.
| Planning quantity | What it means | Example for the project |
|---|---|---|
| Homes passed | Premises along the planned route | 1,000 |
| Homes serviceable | Premises that can actually receive a drop | 900 |
| Year-one subscribers | Serviceable homes multiplied by take rate | 900 x 45% = 405 |
| Three-year design base | Expected connections plus reserve | 1,000 active positions |
Use geographic clusters of 32, 64 or 128 addresses as draft PON groups, but do not freeze them yet. Treat 128 as the registration ceiling of a GPON port rather than a target to fill. Distance, duct availability, and optical loss may move a boundary even when the address count looks balanced.
GPON under ITU-T G.984.2 provides nominal line rates of 2.488 Gbps downstream and 1.244 Gbps upstream per PON port. With simple equal division, 32 subscribers correspond to 77.8 Mbps downstream and 38.9 Mbps upstream each; 64 subscribers correspond to 38.9 Mbps downstream and 19.4 Mbps upstream; 128 subscribers correspond to 19.4 Mbps downstream and 9.7 Mbps upstream. Upstream is the binding figure, because residential demand is asymmetric and dynamic bandwidth allocation changes who receives capacity at a given moment without creating more line rate.
A useful busy-hour test is:
PON demand = subscribers x active-at-once ratio x average active throughput
For 64 subscribers, 25% concurrent use, and 12 Mbps average downstream traffic per active user, demand is 64 x 0.25 x 12 = 192 Mbps. That is comfortable. However, a business-heavy cluster with 40% concurrency at 50 Mbps becomes 64 x 0.40 x 50 = 1,280 Mbps, which deserves a smaller ratio or a different service policy.
| Decision factor | 1:32 split | 1:64 split | 1:128 split |
|---|---|---|---|
| OLT ports for 1,000 active homes | 32 ports | 16 ports | 8 ports |
| Equal-share upstream reference | 38.9 Mbps | 19.4 Mbps | 9.7 Mbps |
| Industry-typical splitter insertion loss | About 17 dB | About 20.5 dB | About 24 dB |
| Optics class typically required | Class B+ | Class B+ or Class C+ | Class C+ |
| Best fit | Higher busy-hour demand, longer paths | Balanced residential zones | Compact, short-reach, low-concurrency zones |
One more ceiling sits above that arithmetic. A GPON port registers up to 128 ONUs under ITU-T G.984, so a 1:128 design is sitting exactly on the limit: there is no spare registration for a replacement unit, a moved subscriber or a trial connection. Industry-typical residential practice is to load a port somewhere around 64 to 96 subscribers and keep the rest for spares and moves.
A gpon olt should therefore be sized from measured demand and the loss model together, not from the largest supported split ratio on a data sheet.
One-stage splitting places the full split at one distribution point. It is easy to document and test because every subscriber path crosses one passive device. A single 1:32 ftth splitter also keeps loss variation predictable. The tradeoff is feeder fiber: serving several streets from one cabinet can require many long distribution runs.
Two-stage splitting uses a primary device near the feeder and smaller secondary devices near subscriber clusters. For example, a 1:4 primary followed by eight 1:8 branches still creates an overall 1:32 ratio. It can save distribution fiber when homes are dispersed, because one fiber reaches each secondary point before branching locally. It also creates another enclosure, connector set, and fault boundary.
Choose two stages when saved distribution fiber and civil work outweigh the added records and optical interfaces. Keep the final ratio visible in the design: 1:4 x 1:8 = 1:32, not “two small splitters.” ITU-T G.984 planning still sees the combined insertion loss, and cascaded devices often add slightly more excess loss than one equivalent stage. Confirm the ftth splitter insertion-loss data for the selected devices. Treat the exact values as vendor-dependent ODN data.
Calculate the worst subscriber path before ordering active equipment. Use the minimum OLT launch power, then subtract every passive loss, cable attenuation, and margin. Compare the result with ONU receiver sensitivity. For a Class B+ planning example, +1.5 dBm minimum launch and -27 dBm ONU sensitivity are industry-typical general values; confirm both against the selected release and optic data.
Received power = OLT launch - splitter - splices - connectors - cable - margin
Consider a 10 km path with a 1:32 split. Use industry-typical planning values of 17.0 dB splitter loss, eight fusion splices at 0.1 dB each, four connector interfaces at 0.5 dB each, conservative cable attenuation of 0.35 dB per km, and 3 dB margin.
| Loss item | Industry-typical planning value |
|---|---|
| 1:32 split | 17.0 dB |
| 8 fusion splices | 0.8 dB |
| 4 connector interfaces | 2.0 dB |
| 10 km cable | 3.5 dB |
| Engineering margin | 3.0 dB |
| Total planned loss | 26.3 dB |
The estimated receive level is +1.5 - 26.3 = -24.8 dBm, leaving 2.2 dB above the industry-common -27 dBm reference after the 3 dB margin is already included. That is a Class B+ port, and ITU-T G.984.2 gives Class B+ a 28 dB budget.
Swap in an industry-typical 20.5 dB 1:64 device and total loss reaches 29.8 dB, which exceeds the B+ budget. Swap in 24.0 dB for 1:128 and it reaches 33.3 dB, which exceeds even the 32 dB Class C+ budget. The wrong reading of those two lines is “do not go past 1:32”. The correct reading is that split ratio and optics class are one decision: Class C+ lifts the budget to 32 dB, and that is what makes 1:64 and 1:128 buildable rather than marginal.
What the class buys is reach. Holding the interface count and the 3 dB margin constant:
| Split ratio | Max reach on Class B+ (28 dB) | Max reach on Class C+ (32 dB) |
|---|---|---|
| 1:32, 17.0 dB | About 15 km | About 26 km, so the ~20 km GPON reach limit binds first |
| 1:64, 20.5 dB | About 5 km | About 16 km |
| 1:128, 24.0 dB | Does not close | About 6 km |
So 1:128 is a genuine option, but it is a short-reach one, and it is the wrong ratio for a dispersed service area. Do not “recover” a deficit by deleting the margin: shorten the path, reduce interfaces, lower the split, or move the port to Class C+.
Separate PON upstream capacity from OLT uplink capacity. The 1.244 Gbps upstream line rate is shared within each PON under ITU-T G.984, while the Ethernet uplink aggregates many PON ports. Dividing 1.244 Gbps by 64 gives 19.4 Mbps as an equal-share reference, not a guaranteed service rate. DBA profiles determine how assured and excess bandwidth are scheduled.
Model the uplink at the busy hour. Suppose 1,000 subscribers have 25% concurrency, and each active session averages 12 Mbps downstream and 3 Mbps upstream. Aggregate demand is 3.0 Gbps down and 0.75 Gbps up. Add an industry-typical 15% allowance for Ethernet framing, PPPoE, bursts, and forecast error: 3.45 Gbps down and 0.86 Gbps up. A 10 Gbps uplink tier is sensible; one gigabit is not.
PPPoE adds an 8-byte header and an authentication boundary described by RFC 2516. Its byte overhead is small on full-size frames, but session tables, keepalives, and BRAS capacity still need explicit sizing. Use the same concurrency assumptions at the access, aggregation, and subscriber-authentication layers.
Define services before creating profiles. A basic residential plan may need Internet today, but the address plan and VLAN scheme should reserve room for voice and multicast IPTV. Internet can use PPPoE in an Internet VLAN; voice can use a separate voice VLAN with appropriate priority; IPTV can use a multicast VLAN with IGMP snooping so channels reach only interested subscriber ports.
IGMPv2 is defined by RFC 2236 and IGMPv3 by RFC 3376. Confirm that the selected ONU mode, OLT software release, and upstream multicast design support the intended workflow. An ONU may bridge tagged services or terminate routing and PPPoE, but those choices change troubleshooting boundaries and customer-premises responsibility.
Rayin can review PON port count, ONU interoperability questions, and service-profile requirements against a planned topology. When selecting a Rayin mini GPON OLT, confirm the exact uplink, profile, multicast, and subscriber limits for the software release rather than treating a generic capability list as a commitment.
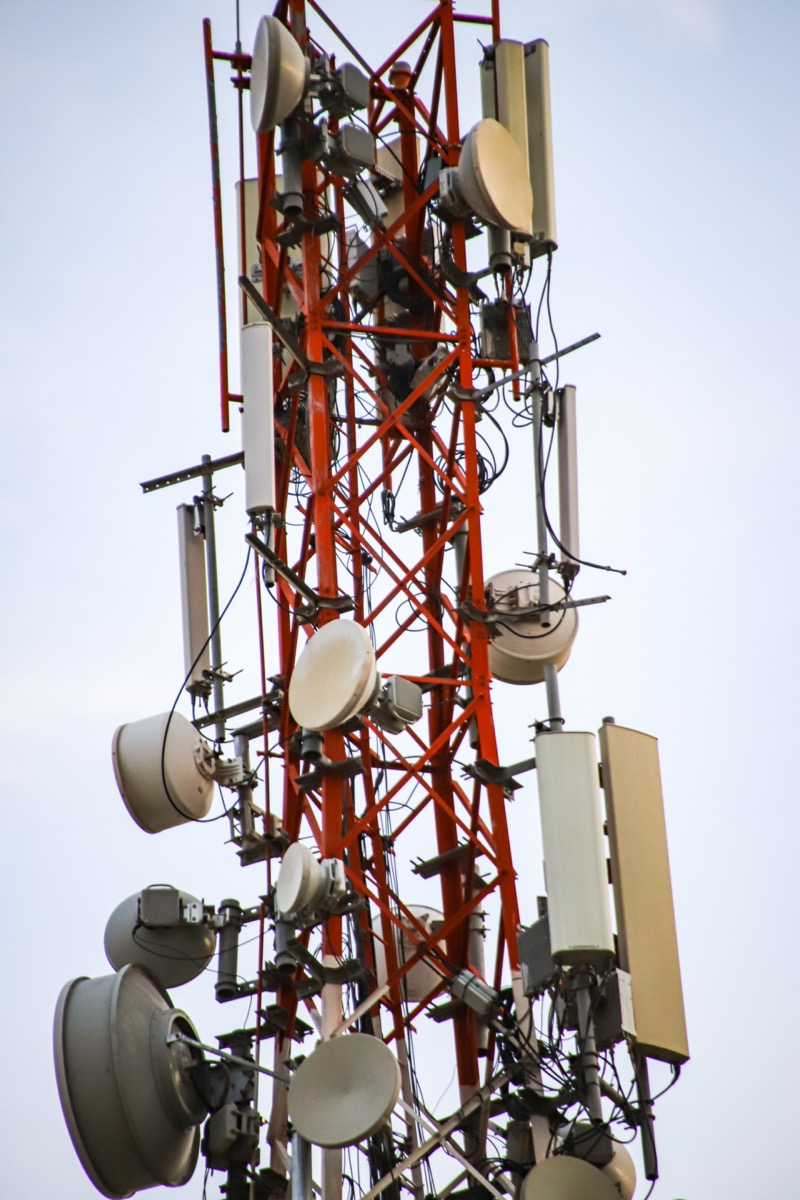
The following plan uses general engineering assumptions, not a product specification. It favours a 1:128 ratio with Class C+ optics in compact, short-reach zones, keeps 1:64 on the longer branches, and requires every path to pass the budget independently.
| Design item | Worked value | Reasoning |
|---|---|---|
| Active subscriber target | 1,000 | Three-year base |
| Active PON ports, compact zones | 8 | ceil(1,000 / 128) |
| Active PON ports, long branches | 16 | ceil(1,000 / 64) |
| Planned positions with 20% reserve | 1,200 | Growth without immediate redesign |
| PON ports including reserve | 10 and 19 | ceil(1,200 / 128) and ceil(1,200 / 64) |
| Split hierarchy | 1:8 then 1:16 | Overall 1:128; 1:64 where reach or concurrency says no |
| Optics class | Class C+ on the high-ratio ports | 24 dB splitter loss does not close on Class B+ |
| Longest branch | About 6 km, with the 3 dB margin held | Branches beyond that drop to 1:64 |
| Busy-hour aggregate | 3.45 Gbps down, 0.86 Gbps up | Includes 15% general allowance |
| Aggregation tier | 10 Gbps | Leaves room for bursts and growth |
| Service reserve | Internet, voice VLAN, multicast IPTV | Avoids later VLAN redesign |
At that ratio the equal-share upstream reference falls to about 9.7 Mbps per subscriber, so re-run the busy-hour model at that ratio before committing to it; the ratio that saves PON ports can cost you the peak-hour experience.
Procure the required ODN materials as neutral infrastructure: cable, closures, cabinets, splitters, pigtails, patch cords, and labeling supplies. Rayin does not present those passive materials here as products for sale. Acceptance should reconcile every route, splice, connector, and measured receive level with the design record before subscriber activation.
How many GPON ports are needed for 1,000 subscribers?
At 1:64, 1,000 active subscribers require 16 PON ports; at 1:32, 32; at 1:128, 8. With a 20% reserve the totals become 19, 38 and 10. Note that 128 is also the registration ceiling for one GPON port, so that design leaves no headroom for spares or moves. Geography, optical loss and busy-hour concurrency can all require more ports than the arithmetic minimum.
Is a higher split ratio always cheaper?
No. Each step up halves the PON ports but costs about 3.5 dB of industry-typical splitter loss and halves the shared upstream again: roughly 38.9 Mbps per subscriber at 1:32, 19.4 at 1:64 and 9.7 at 1:128. Past 1:64 you also need Class C+ optics, and reach drops sharply. Savings disappear if longer routes need redesign or busy-hour demand forces smaller groups.
Why keep a 3 dB optical margin?
An industry-typical 3 dB engineering margin absorbs aging, repairs, connector contamination, temperature variation, and measurement uncertainty. It is not spare loss to consume during initial construction. A path that passes only after removing the margin is already outside the conservative design and should be corrected before activation.
Does PPPoE consume much GPON bandwidth?
PPPoE adds an 8-byte header under RFC 2516, so its direct percentage is modest on large Ethernet frames. The larger planning issues are concurrent sessions, BRAS throughput, authentication bursts, keepalives, and smaller effective MTU. Include protocol allowance in the aggregate model instead of subtracting a fixed rate per user.
What should an ISP verify before ordering an OLT?
Verify PON port count, uplink capacity, confirmed optical class, ONU interoperability, DBA profiles, VLAN scale, PPPoE pass-through, multicast behavior, and software limits. Match those facts to the route-level loss sheet and busy-hour model. A feature name without a tested subscriber workflow is not an acceptance criterion.
A reliable design closes the loop between demand, split topology, optical loss, and busy-hour traffic. Run the 1,000-home calculation with measured routes and confirmed equipment data before procurement, then preserve margin for growth rather than spending it on day one.
The specifications, thresholds and standard references quoted above come from public industry sources — the ITU-T G.984 GPON series including the G.984.2 optical classes (Class B+ 28 dB, Class C+ 32 dB) and the 128 ONU registration ceiling, PPPoE and multicast related RFCs, and published vendor documentation — rather than from marketing copy. Splitter insertion loss figures of roughly 17 dB at 1:32, 20.5 dB at 1:64 and 24 dB at 1:128, and the reach figures derived from them, are industry-typical planning values, not measurements of a Rayin product. The method, worked examples and wording are written by Sara, who checked each figure against those sources before publication. Anything presented as an industry-typical value is labelled as such; nothing here is a measured figure from a Rayin product unless it says so.
About the author: Sara — Sara is a Customer Manager at Rayin with over 10 years of experience in the communications field. In her free time, she enjoys badminton and swimming.
About Rayin: Shenzhen Rayin Technology Co., Ltd. — Company Profile